How to check Valkyrie dashboard Overview
The functionality for the Valkyrie Dashboard has been enhanced with an overview, recent analysis requests and unknown file hunter scans sections on Overview as a friendly way of analyzing the file.In this section, we are going to concentrate on Dashboard Overview.
Step [1]: Login into Valkyrie,
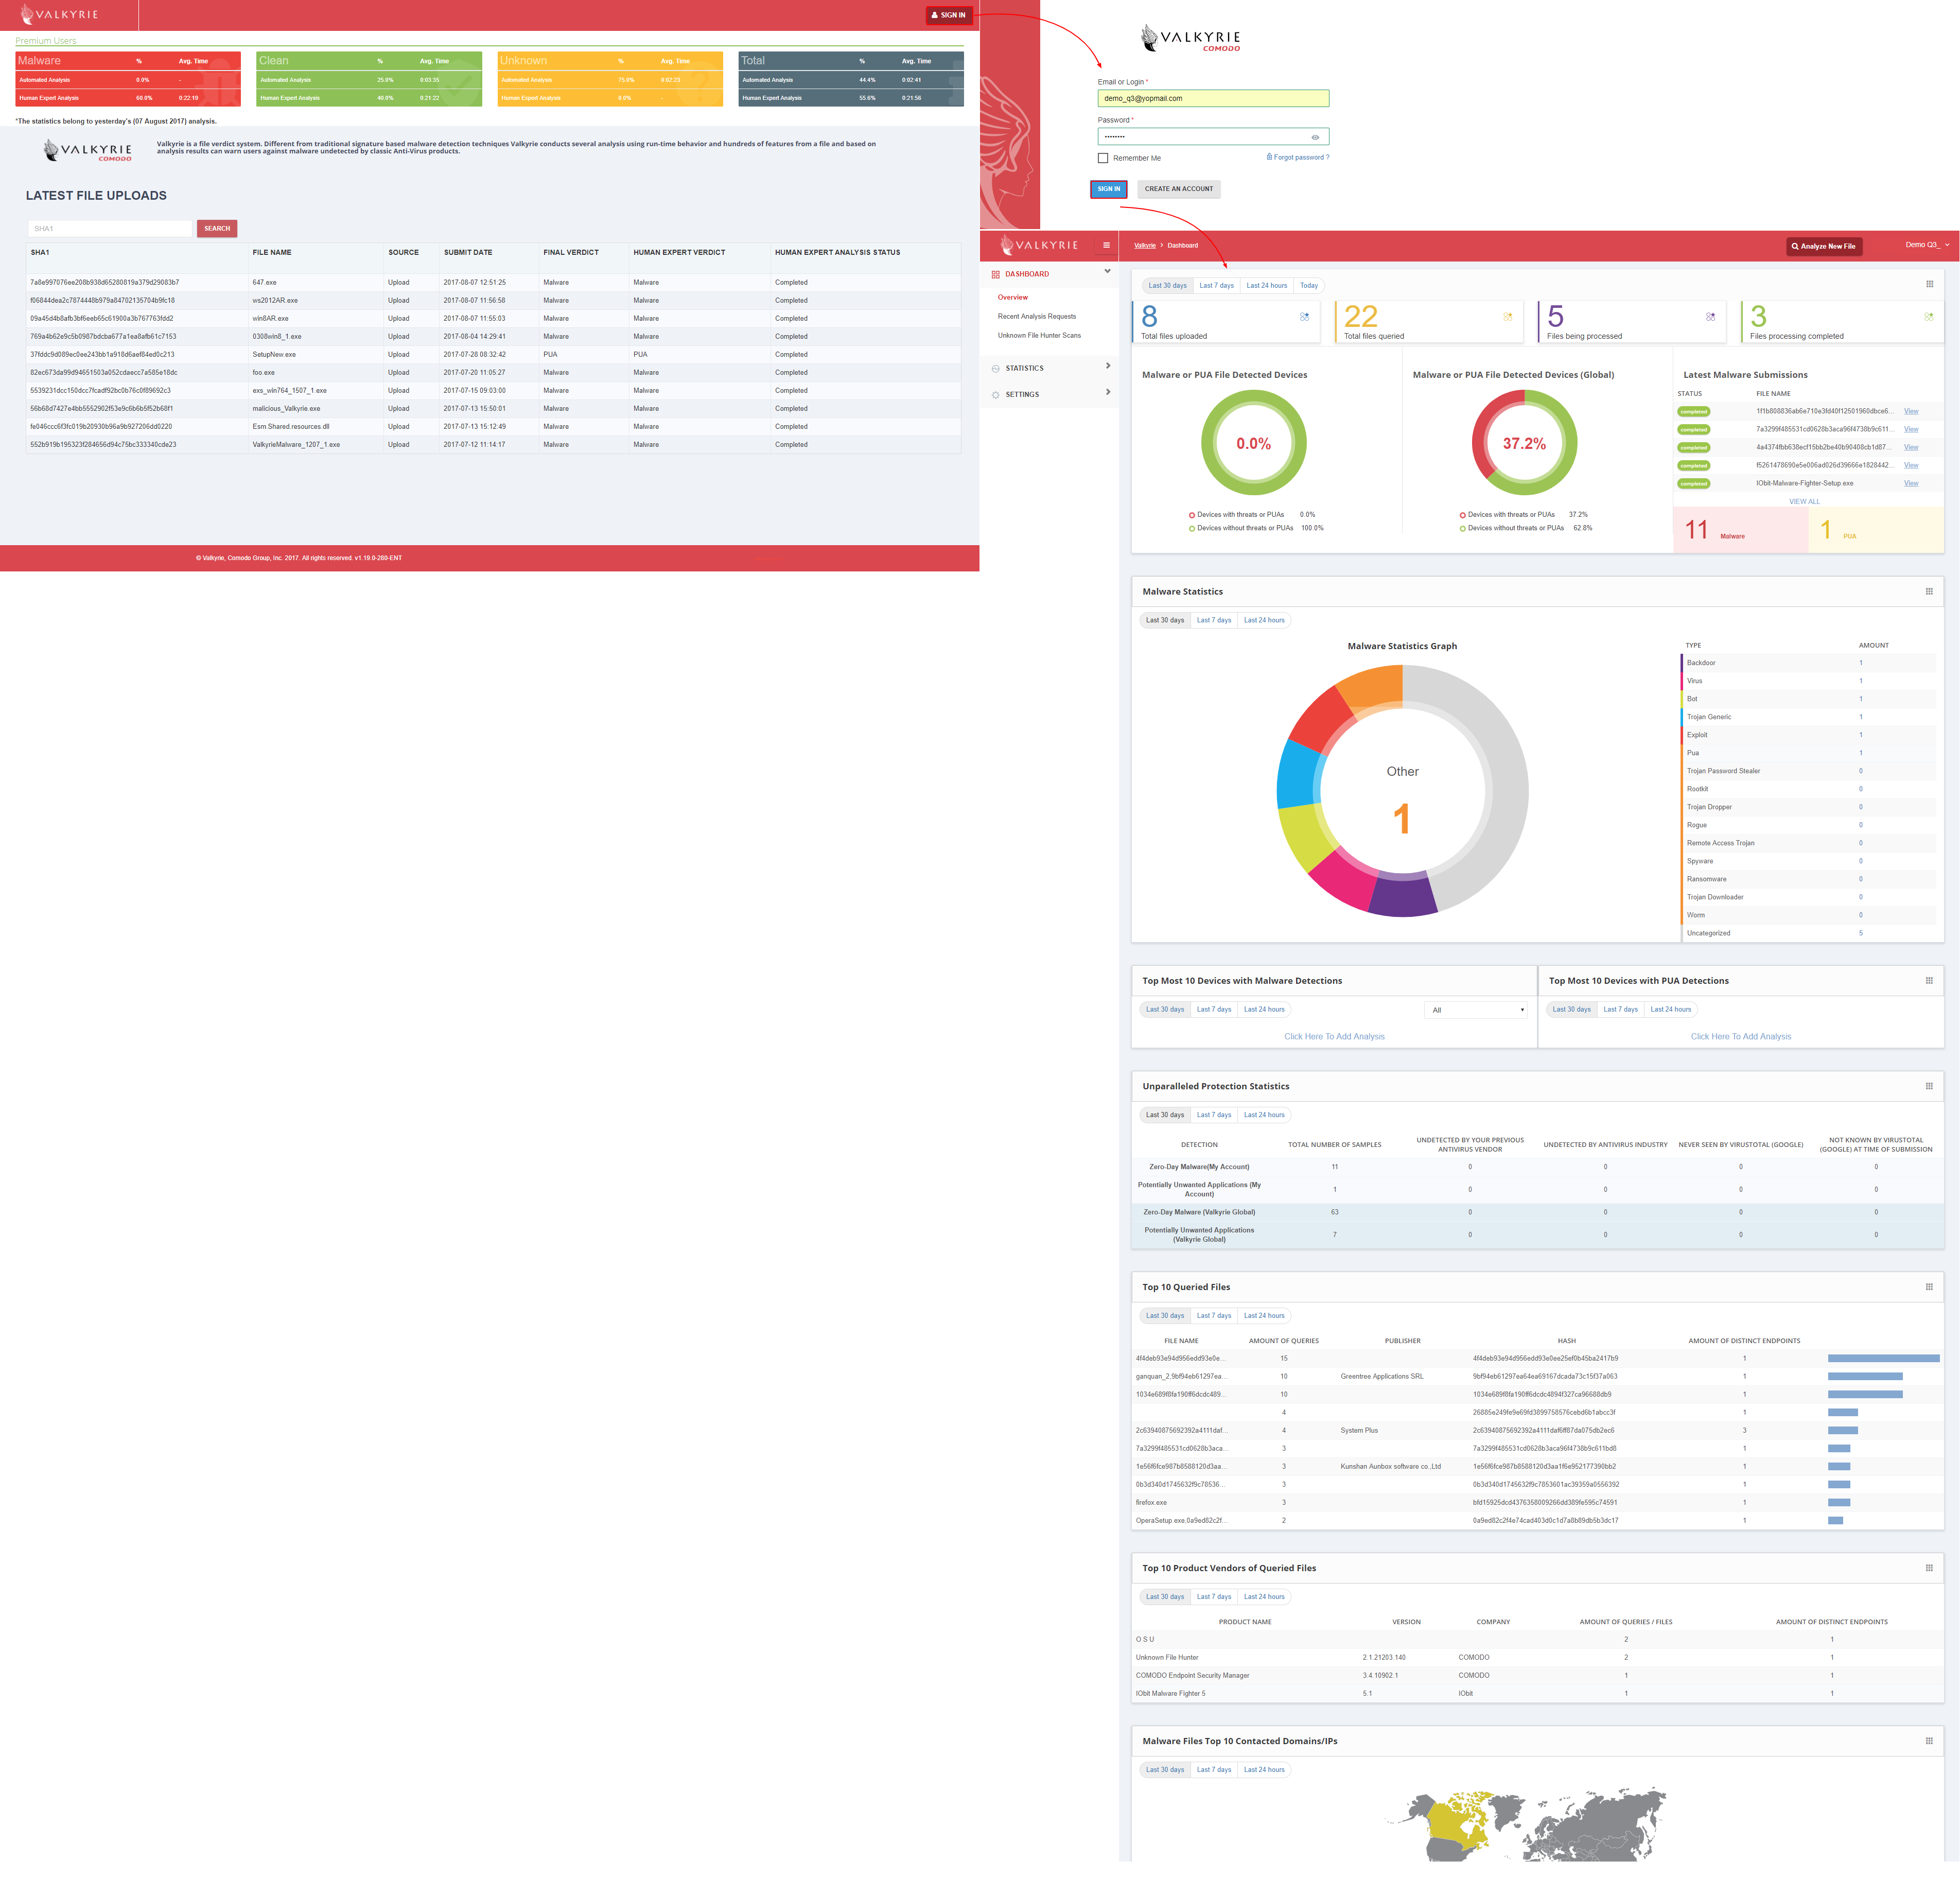
Go to --> https://valkyrie.comodo.com click Sign In Button which is available on the top most corner of the page, by clicking it will navigate to signup page on that provide credentials of your C1 account and click "Sign In" Button.It will display the Valkyrie dashboard Overview which provides the overall statistics for the devices that have been linked to a user account
DashBoard Overview:
The dashboard provides the overall statistics of the devices that are linked to a user account.It has many sections for detecting risk that is enrolled to a particular account.The overall statistics of the Total Files Upload, Total Files Queried, Files being Processed and Files Being Completed Statistics have been provided on the top.By this feature, users can able to track the file details.Newly they have provided the feature for analyzing the file on the top with "Analyze new file" as an user-friendly.
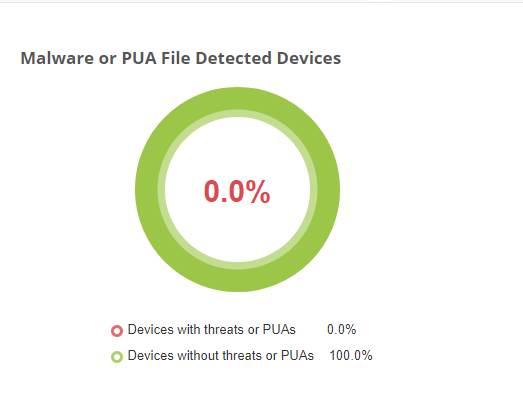
Malware or PUA File Detected Devices: This field depicts the diagrammatic representation of the devices with or without threats of PUAs.By this feature, a user can able to view the device details of the affected malware file.
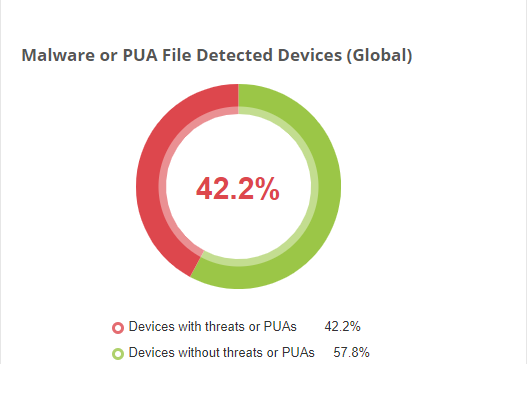
Malware or PUA File Detected Devices (Global): It illustrates the diagrammatic representation of the devices with or without threats or PUAs as like Malware or PUA file detected devices but in a global manner.
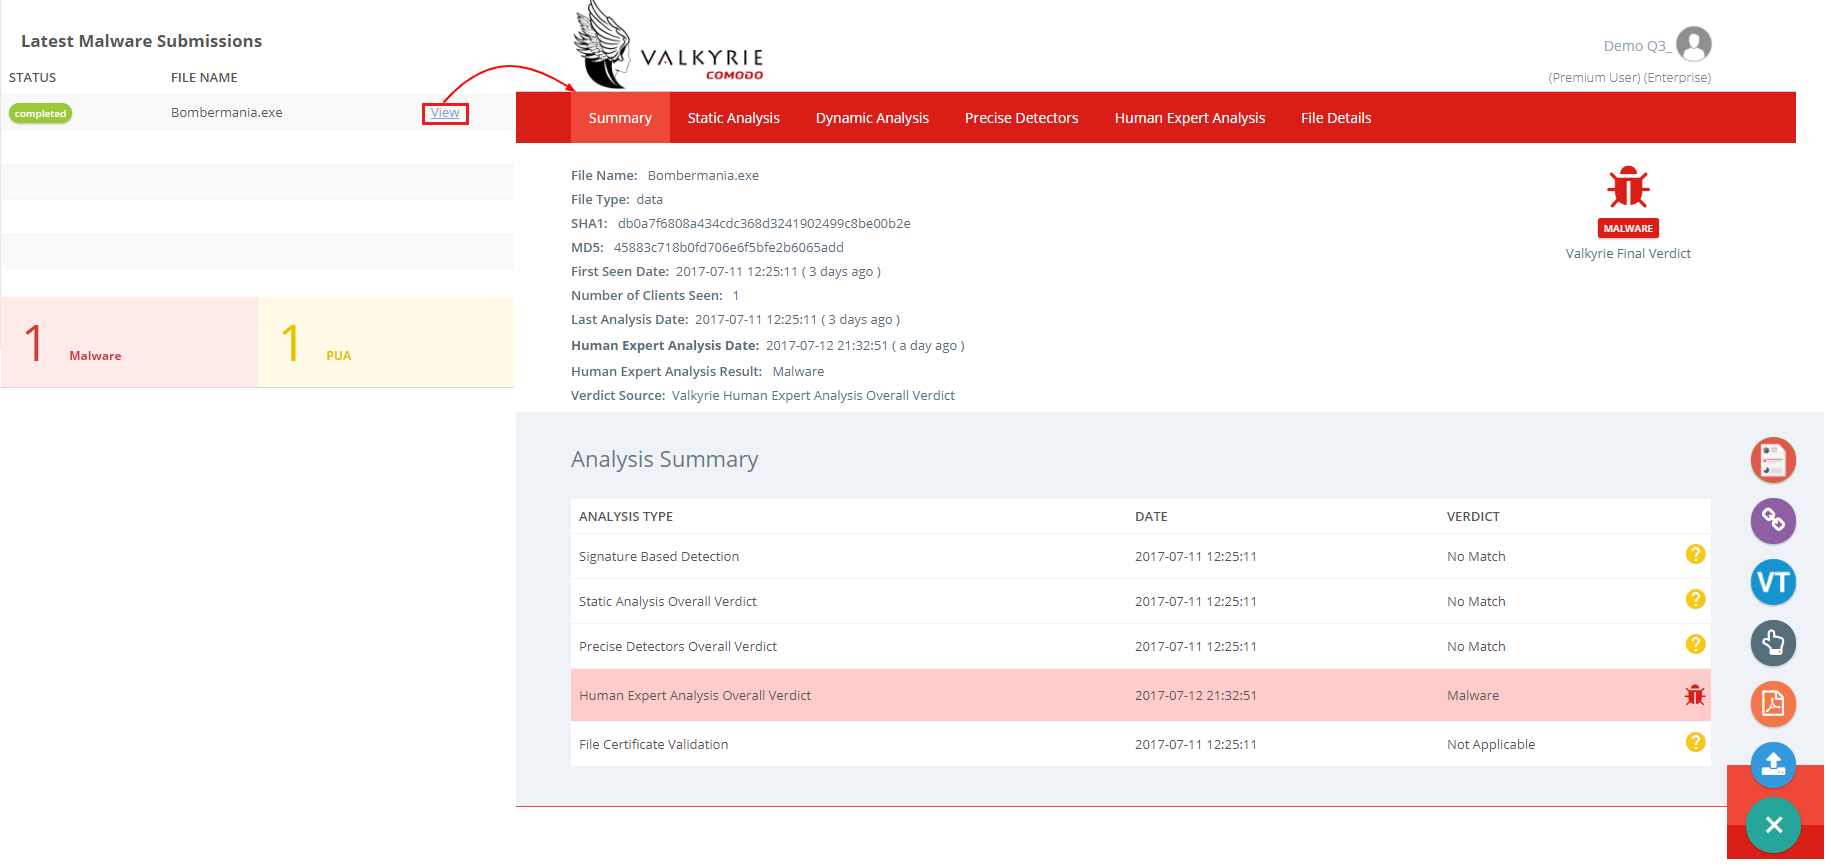
Latest Malware Submissions: It displays the records of the latest malware submissions along with the status.By clicking the view button, it navigates to the next page where a detailed description of the selected malware file resides.Based on the file report it will be placed on PUA and malware file list present on the bottom.This widget lists the most recently detected files along with the result without searching the particular file information.
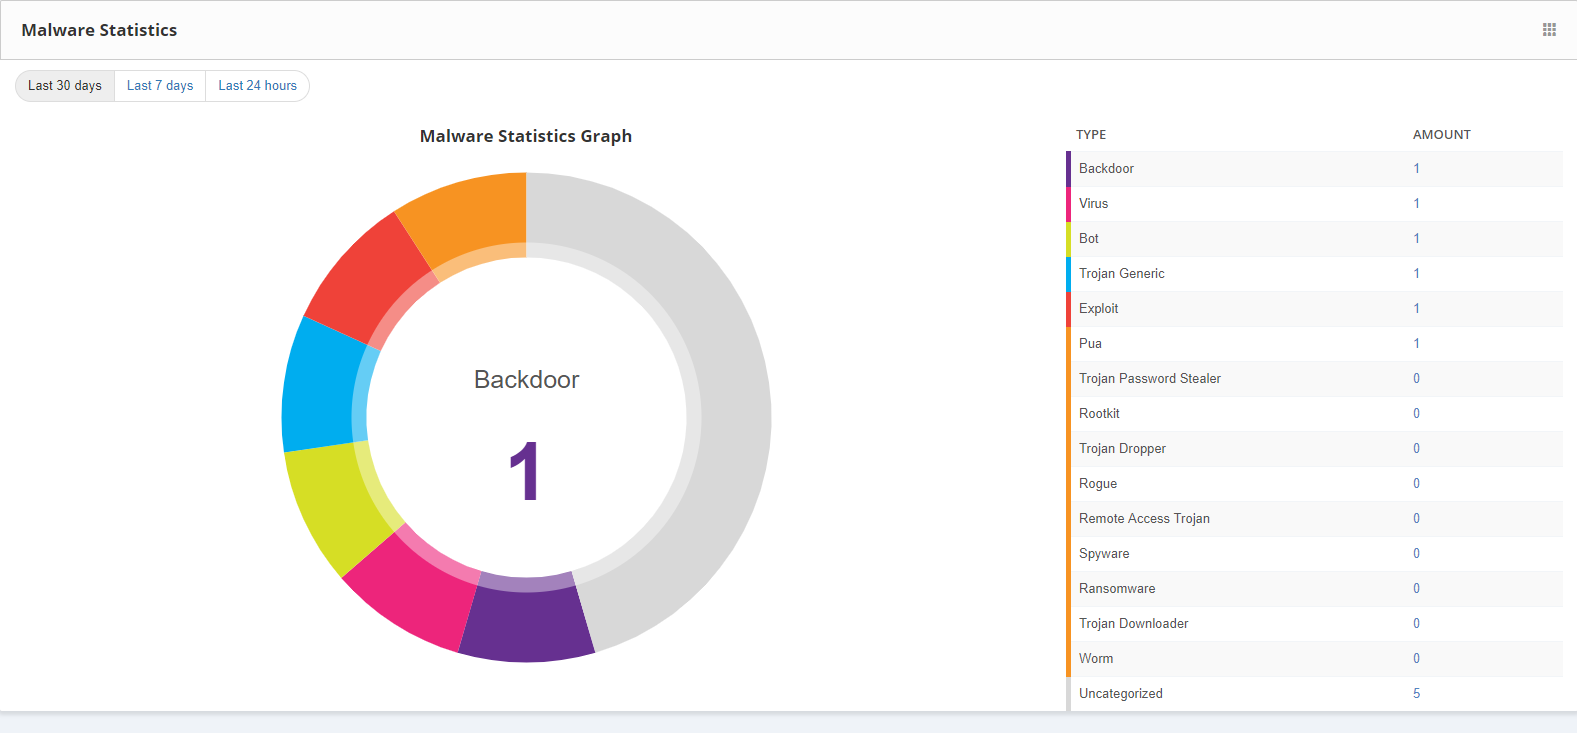
Malware Statistics: It displays the report of the malware files as a statistic graph.By this new widget, users can able to view the distribution of malware file according to the malware families.
Note:
- We can add the file to an analysis by clicking the Click here to Add Analysis.
- Sorting the file details can be done by selecting the last 30 days, last 7 days and last 24 hours.
- We can simply move the fields of the dashboard by using widgets.
Top Most 10 Devices with Malware Detections: It lists the devices where the malware files have been analyzed.By this feature, users can able to protect the devices which are more vulnerable for the malware files.
Unparalleled Protection Statistics: This displays the detection files based upon Zero-Day Malware(My Account), Potentially Unwanted Applications (PUA)(My Account), Zero-Day Malware (Valkyrie Global), Potentially Unwanted Applications (PUA) (Valkyrie Global) with the Total no. of samples, Undetected by your previous antivirus vendor, Undetected by Antivirus Industry, Never seen by Virus Total(Google) and not known by virus total (Google) at the time of submission.This feature used for viewing malware and PUA file which are not detected by any company before and this helps the user to take some precautionary measures
Top 10 Queried Files: It displays the last analyzed files in user devices.By this feature, it allows the files that are seen on the endpoint which was analyzed.
Top 10 Product Vendors of Queried Files: It displays the last analyzed products in user devices.By this feature, it allows the most checked products on the endpoint.
Malware Files Top 10 Contacted Domains/IPs:
It lists the IP where the most malware files have been analyzed.By this feature, the users can able to set precautionary steps for the malware files on the domain.
